Free infographics for the field.
We turned publicly available data from hundreds of agencies into ready-to-use infographics you can hand directly to legislators, funders, or your constituents.
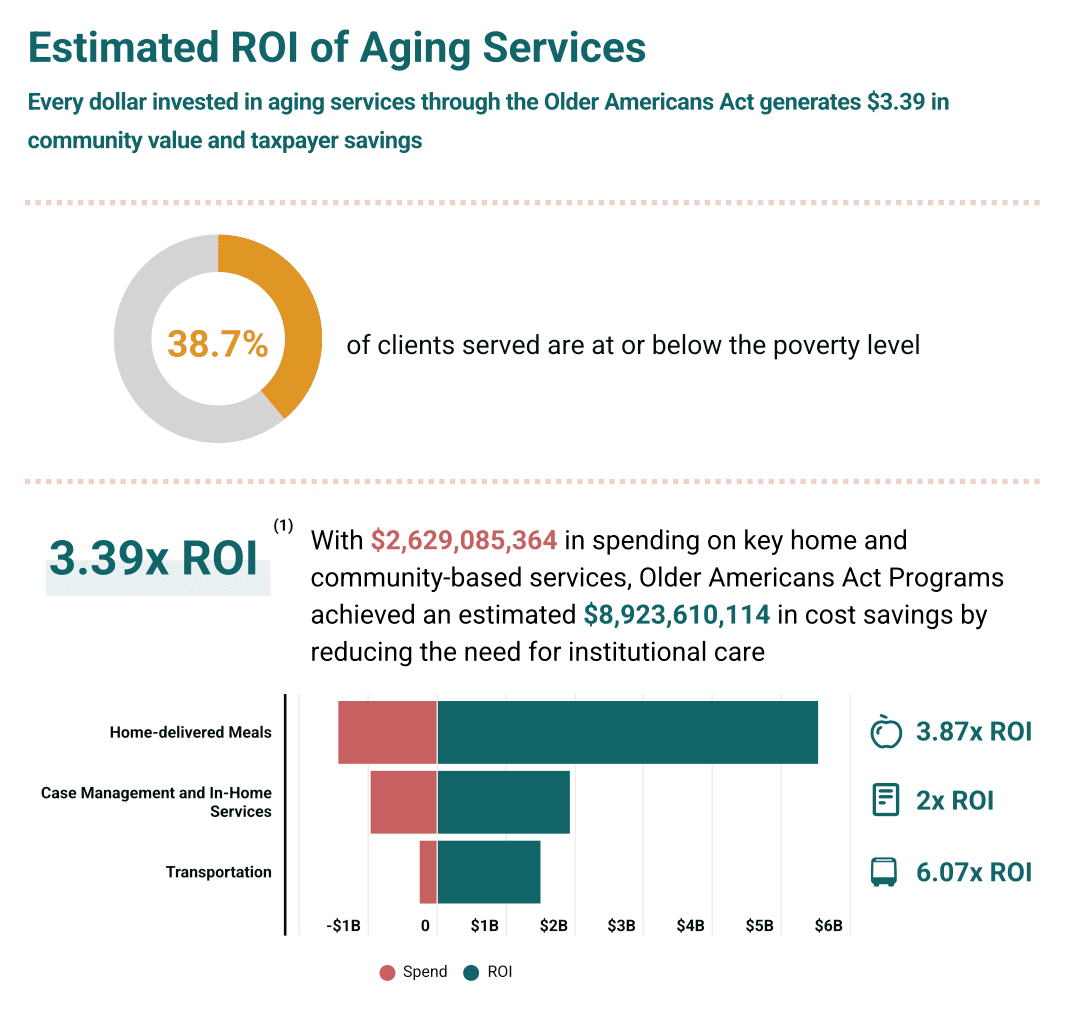
Every dollar invested in aging services returns $3.39 in community value.
Per-state ROI infographics for Older Americans Act services — case management, transportation, home-delivered meals, and more.
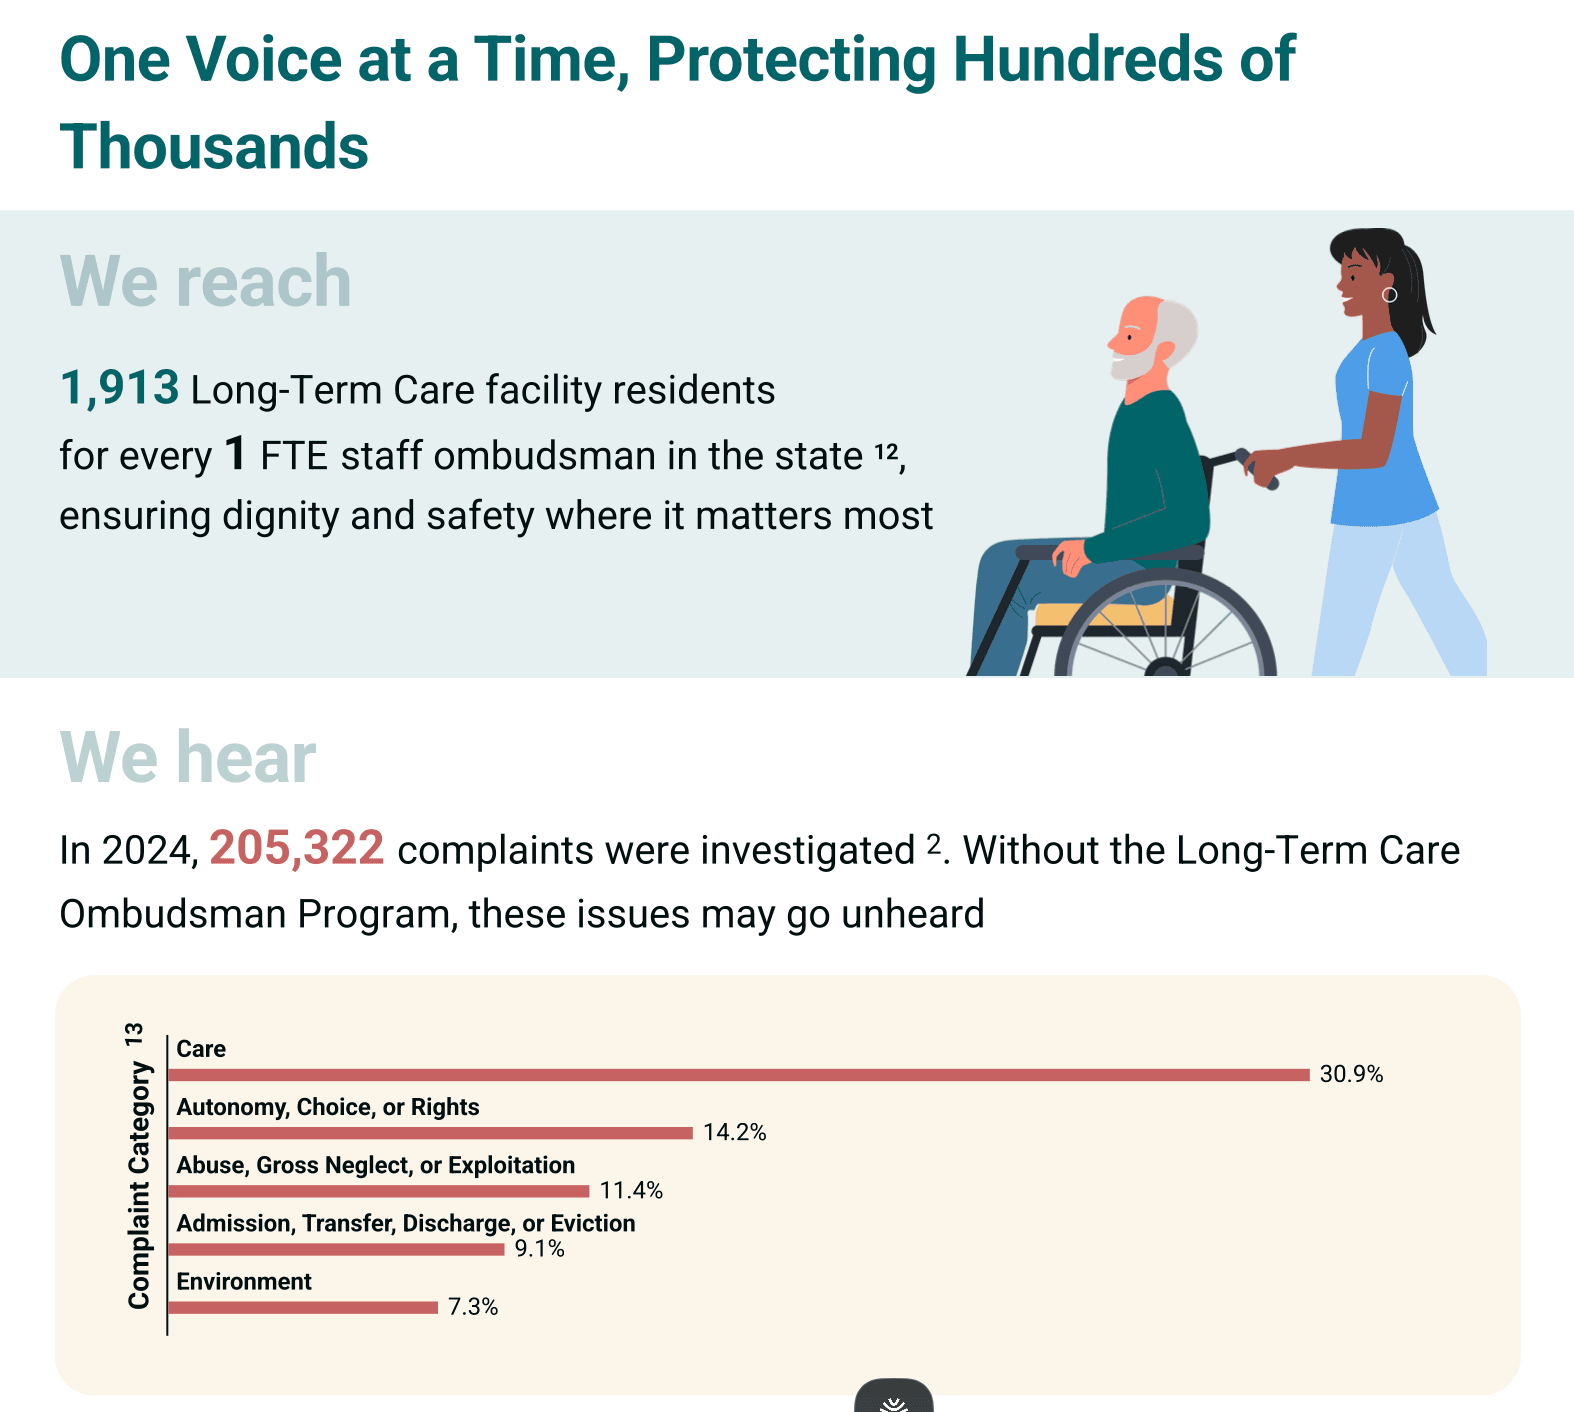
One ombudsman protects 1,913 long-term care residents.
How the Long-Term Care Ombudsman Program ensures dignity, safety, and residents' rights across 50,000+ facilities.
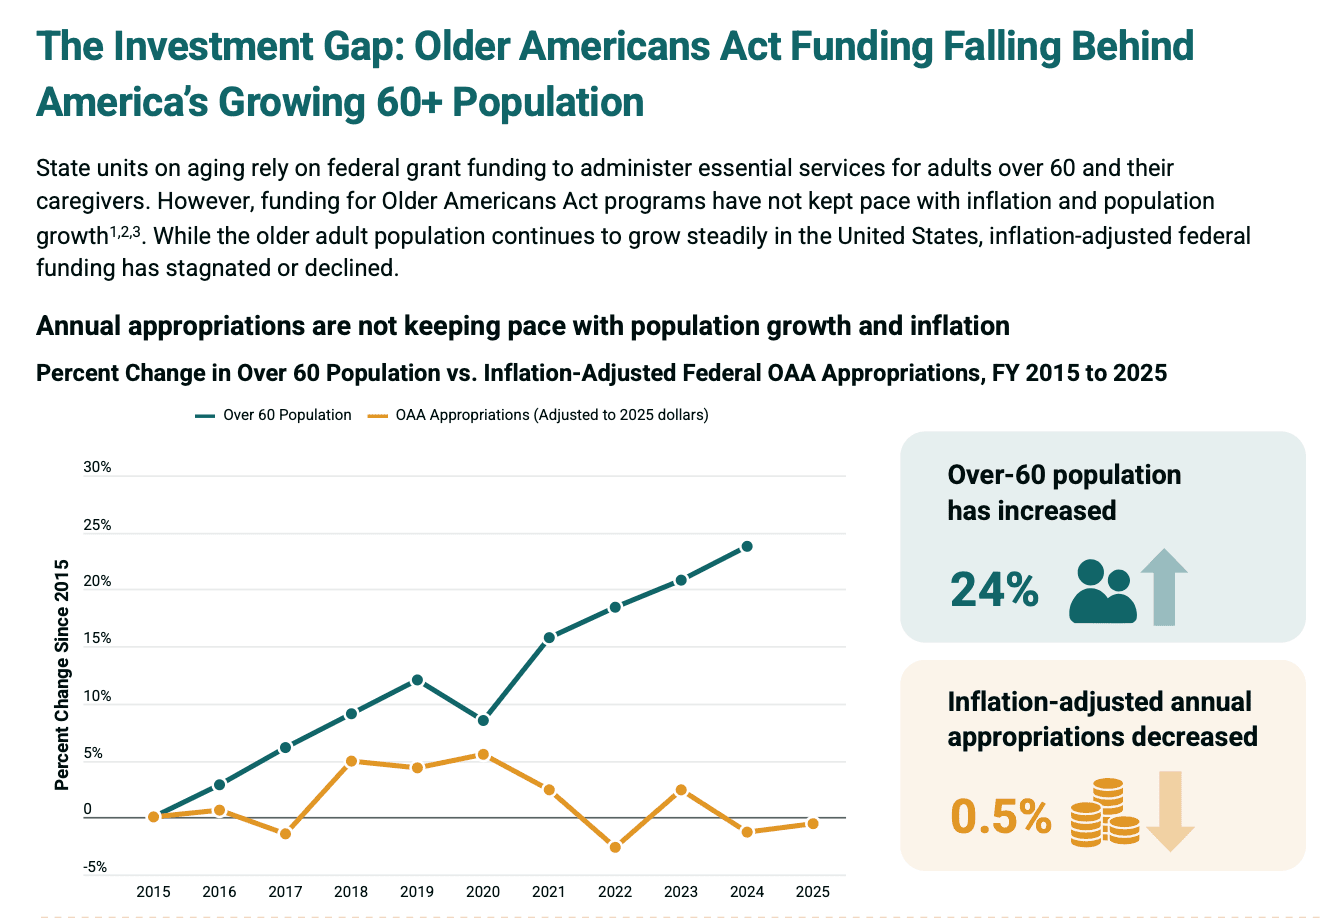
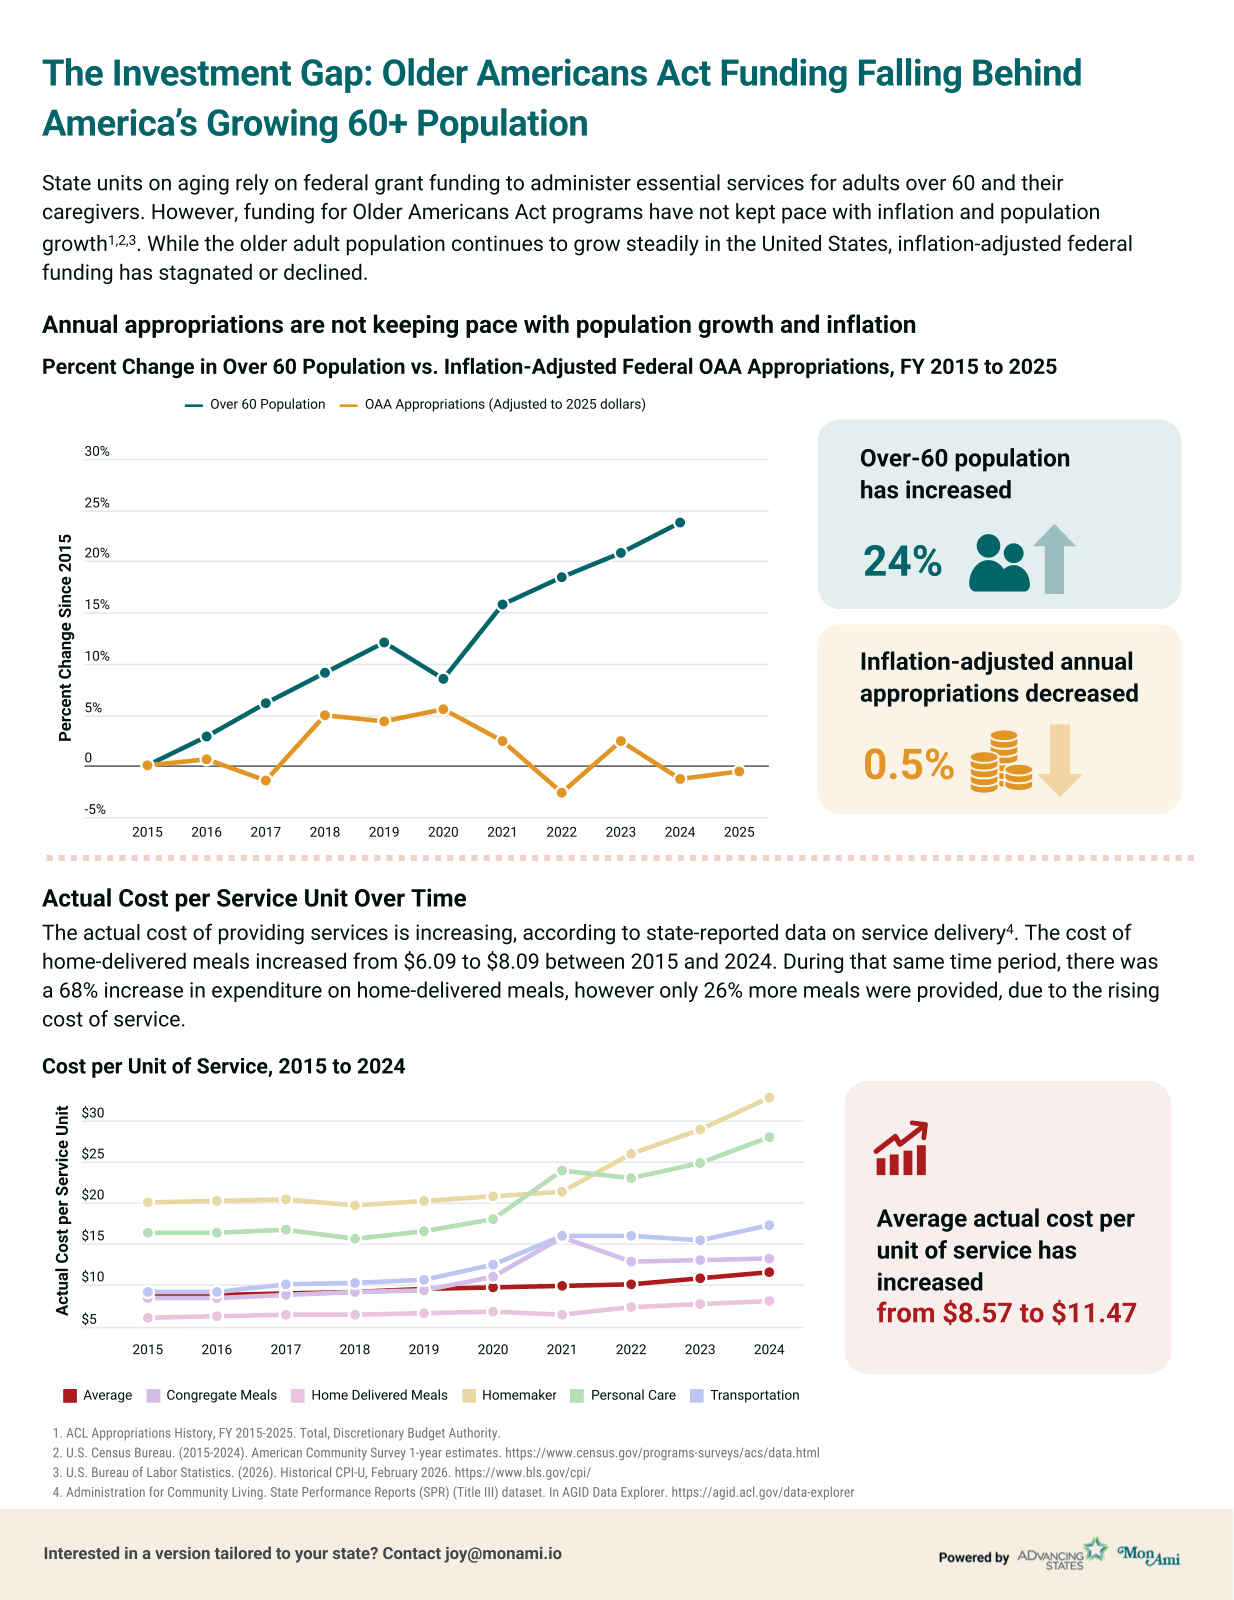
The over-60 population grew 24%. Funding fell 0.5%.
Inflation-adjusted federal OAA appropriations have not kept pace with population growth. A one-page reference for advocates, AAA directors, and state legislative staff.
Where the $4.47 billion in OAA funding actually goes.
An interactive national + per-state explorer of Older Americans Act spending — service category breakdowns, ROI signals, and the data behind the funding gap. Use it for advocacy, board decks, and reauthorization briefings.